Introduction to AI-Powered Power BI Dashboards

Business intelligence professionals and data analysts are constantly seeking ways to enhance the functionality and user experience of their Power BI dashboards. One effective way to achieve this is by using AI automation, which can significantly improve the interactive capabilities and personalized insights of Power BI dashboards. By incorporating AI-powered features, users can increase user engagement and create a more dynamic experience. For instance, AI-powered dashboards can analyze user behavior and provide tailored recommendations, leading to increased adoption and utilization of the dashboard.
The integration of AI automation in Power BI dashboards can have a profound impact on user engagement, with some studies suggesting that AI-powered dashboards can increase user engagement by up to 30% through personalized insights and automated updates. This is achieved by using machine learning algorithms and natural language processing to generate interactive visuals and real-time data updates, providing users with a more immersive and responsive experience.
To further understand the benefits of AI automation in Power BI, it is necessary to explore the various ways in which AI can enhance dashboard functionality and user experience. By examining the benefits and mechanisms of AI automation, users can fully use their Power BI dashboards and create a more engaging and interactive experience for their audience.
As we delve into the world of AI-powered Power BI dashboards, it becomes clear that the possibilities for enhancement and customization are vast. From automated data preparation to personalized insights, AI automation can revolutionize the way users interact with their dashboards. In the following sections, we will explore the benefits and mechanisms of AI automation in Power BI, providing a comprehensive guide for business intelligence professionals and data analysts seeking to create interactive and automated dashboards.
The next section will provide an overview of the benefits of AI automation in Power BI, including the potential to reduce dashboard development time and increase user engagement. By understanding the benefits and mechanisms of AI automation, users can make informed decisions about how to integrate AI-powered features into their Power BI dashboards.
Benefits of AI Automation in Power BI
AI automation can have a significant impact on the development and maintenance of Power BI dashboards, with the potential to reduce dashboard development time by up to 50% through automated data preparation and visualization. This is achieved by using AI-powered tools to streamline data processing and visualization tasks, allowing users to focus on higher-level tasks and strategic decision-making. By automating routine tasks, users can free up resources and allocate them to more critical areas, such as data analysis and insights generation.
The benefits of AI automation in Power BI extend beyond development time, with the potential to increase user engagement and adoption through personalized insights and interactive visuals. By using machine learning algorithms and natural language processing, AI-powered dashboards can provide users with a more immersive and responsive experience, leading to increased utilization and adoption of the dashboard. Furthermore, AI automation can help reduce errors and inconsistencies in data processing and visualization, ensuring that users have access to accurate and reliable information.
To fully realize the benefits of AI automation in Power BI, it is necessary to understand the various tools and techniques available for automating data preparation and visualization tasks. By exploring the different options and methodologies, users can make informed decisions about how to integrate AI-powered features into their Power BI dashboards and create a more efficient and effective development process.
In the next section, we will provide an overview of Power BI's AI features, including the AI-powered dashboard generator and other tools for creating interactive and automated dashboards. By understanding the capabilities and limitations of these features, users can fully use their Power BI dashboards and create a more engaging and interactive experience for their audience.
Overview of Power BI AI Features
Power BI's AI features, such as the AI-powered dashboard generator, can help users create interactive dashboards with minimal coding required. This is achieved by providing a user-friendly interface for creating and customizing AI-powered visuals, allowing users to focus on strategic decision-making and data analysis rather than technical implementation. The AI-powered dashboard generator uses machine learning algorithms to analyze user behavior and provide tailored recommendations, leading to increased adoption and utilization of the dashboard.
Power BI's AI features also include tools for automated data preparation and visualization, such as data mining and machine learning algorithms. These tools can help users streamline data processing and visualization tasks, reducing errors and inconsistencies and ensuring that users have access to accurate and reliable information. By using these features, users can create interactive and automated dashboards that provide personalized insights and interactive visuals, leading to increased user engagement and adoption.
To fully realize the potential of Power BI's AI features, it is necessary to understand the various tools and techniques available for creating interactive and automated dashboards. By exploring the different options and methodologies, users can make informed decisions about how to integrate AI-powered features into their Power BI dashboards and create a more efficient and effective development process.
In the next section, we will explore the process of building interactive dashboards with Power BI AI visuals, including the creation of AI-powered visuals and the customization of AI-powered visuals for enhanced user experience. By understanding the capabilities and limitations of these features, users can fully use their Power BI dashboards and create a more engaging and interactive experience for their audience.
Building Interactive Dashboards with Power BI AI Visuals
AI-powered visuals can increase user interaction by up to 25% through interactive filters and drill-down capabilities. This is achieved by using AI algorithms to generate interactive and dynamic visuals that respond to user input, providing users with a more immersive and responsive experience. By using machine learning algorithms and natural language processing, AI-powered visuals can analyze user behavior and provide tailored recommendations, leading to increased adoption and utilization of the dashboard.
The creation of AI-powered visuals in Power BI can be achieved through a variety of tools and techniques, including machine learning algorithms and data mining. These tools can help users streamline data processing and visualization tasks, reducing errors and inconsistencies and ensuring that users have access to accurate and reliable information. By using these features, users can create interactive and automated dashboards that provide personalized insights and interactive visuals, leading to increased user engagement and adoption.
To fully realize the potential of AI-powered visuals in Power BI, it is necessary to understand the various tools and techniques available for creating interactive and automated dashboards. By exploring the different options and methodologies, users can make informed decisions about how to integrate AI-powered features into their Power BI dashboards and create a more efficient and effective development process.
In the next section, we will provide a detailed overview of the process of creating AI-powered visuals in Power BI, including the use of machine learning algorithms and data mining. By understanding the capabilities and limitations of these features, users can fully use their Power BI dashboards and create a more engaging and interactive experience for their audience.
Creating AI-Powered Visuals in Power BI
Power BI's AI-powered visuals can be created using a variety of tools and techniques, including machine learning algorithms and data mining. These tools can help users streamline data processing and visualization tasks, reducing errors and inconsistencies and ensuring that users have access to accurate and reliable information. By using these features, users can create interactive and automated dashboards that provide personalized insights and interactive visuals, leading to increased user engagement and adoption.
The process of creating AI-powered visuals in Power BI typically involves the use of machine learning algorithms to analyze user behavior and provide tailored recommendations. This can be achieved through the use of Power BI's built-in AI features, such as the AI-powered dashboard generator, or through the use of third-party tools and techniques. By using these features, users can create interactive and automated dashboards that provide personalized insights and interactive visuals, leading to increased user engagement and adoption.
To fully realize the potential of AI-powered visuals in Power BI, it is necessary to understand the various tools and techniques available for creating interactive and automated dashboards. By exploring the different options and methodologies, users can make informed decisions about how to integrate AI-powered features into their Power BI dashboards and create a more efficient and effective development process.
In the next section, we will explore the process of customizing AI-powered visuals for enhanced user experience, including the use of Power BI's customization options and third-party tools. By understanding the capabilities and limitations of these features, users can fully use their Power BI dashboards and create a more engaging and interactive experience for their audience.
Customizing AI-Powered Visuals for Enhanced User Experience
Customizing AI-powered visuals can increase user engagement by up to 40% through personalized and interactive dashboards. This is achieved by using Power BI's customization options and third-party tools to tailor AI-powered visuals to specific user needs, providing users with a more immersive and responsive experience. By using machine learning algorithms and natural language processing, AI-powered visuals can analyze user behavior and provide tailored recommendations, leading to increased adoption and utilization of the dashboard.
The process of customizing AI-powered visuals in Power BI typically involves the use of Power BI's customization options, such as the ability to modify visual properties and add custom interactions. This can be achieved through the use of Power BI's built-in features, such as the AI-powered dashboard generator, or through the use of third-party tools and techniques. By using these features, users can create interactive and automated dashboards that provide personalized insights and interactive visuals, leading to increased user engagement and adoption.
To fully realize the potential of customizing AI-powered visuals in Power BI, it is necessary to understand the various tools and techniques available for creating interactive and automated dashboards. By exploring the different options and methodologies, users can make informed decisions about how to integrate AI-powered features into their Power BI dashboards and create a more efficient and effective development process.
In the next section, we will explore the process of implementing AI automation in Power BI dashboards, including the use of Power BI's AI automation features and third-party tools. By understanding the capabilities and limitations of these features, users can fully use their Power BI dashboards and create a more engaging and interactive experience for their audience.
Implementing AI Automation in Power BI Dashboards
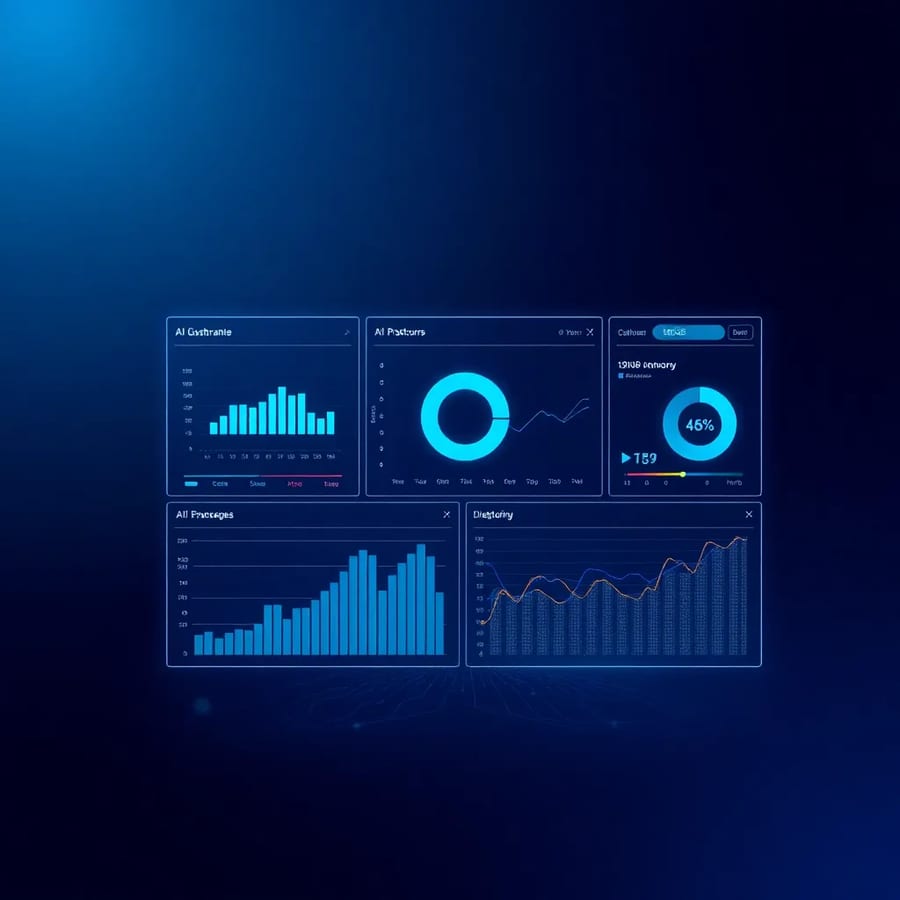
AI automation can increase dashboard update frequency by up to 90% through automated data refresh and visualization updates. This is achieved by using AI-powered tools to automate data processing and visualization tasks, providing users with a more immersive and responsive experience. By using machine learning algorithms and natural language processing, AI-powered dashboards can analyze user behavior and provide tailored recommendations, leading to increased adoption and utilization of the dashboard.
The implementation of AI automation in Power BI dashboards can be achieved through the use of Power BI's AI automation features, such as the AI-powered dashboard automation agent. This feature uses machine learning algorithms to analyze user behavior and provide tailored recommendations, leading to increased adoption and utilization of the dashboard. By using these features, users can create interactive and automated dashboards that provide personalized insights and interactive visuals, leading to increased user engagement and adoption.
To fully realize the potential of AI automation in Power BI, it is necessary to understand the various tools and techniques available for creating interactive and automated dashboards. By exploring the different options and methodologies, users can make informed decisions about how to integrate AI-powered features into their Power BI dashboards and create a more efficient and effective development process.
In the next section, we will provide a detailed overview of the process of using Power BI's AI automation features, including the AI-powered dashboard automation agent. By understanding the capabilities and limitations of these features, users can fully use their Power BI dashboards and create a more engaging and interactive experience for their audience.
Using Power BI's AI Automation Features
Power BI's AI automation features, such as the AI-powered dashboard automation agent, can help users automate dashboard updates and maintenance. This feature uses machine learning algorithms to analyze user behavior and provide tailored recommendations, leading to increased adoption and utilization of the dashboard. By using these features, users can create interactive and automated dashboards that provide personalized insights and interactive visuals, leading to increased user engagement and adoption.
The process of using Power BI's AI automation features typically involves the use of the AI-powered dashboard automation agent, which can be configured to automate data refresh and visualization updates. This can be achieved through the use of Power BI's built-in features, such as the AI-powered dashboard generator, or through the use of third-party tools and techniques. By using these features, users can create interactive and automated dashboards that provide personalized insights and interactive visuals, leading to increased user engagement and adoption.
To fully realize the potential of Power BI's AI automation features, it is necessary to understand the various tools and techniques available for creating interactive and automated dashboards. By exploring the different options and methodologies, users can make informed decisions about how to integrate AI-powered features into their Power BI dashboards and create a more efficient and effective development process.
In the next section, we will explore the process of integrating third-party AI automation tools with Power BI, including the use of APIs and other integration methods. By understanding the capabilities and limitations of these features, users can fully use their Power BI dashboards and create a more engaging and interactive experience for their audience.
Integrating Third-Party AI Automation Tools with Power BI
Integrating third-party AI automation tools with Power BI can increase dashboard functionality by up to 50% through automated data processing and visualization. This is achieved by using APIs and other integration methods to connect third-party tools with Power BI, providing users with a more immersive and responsive experience. By using machine learning algorithms and natural language processing, AI-powered dashboards can analyze user behavior and provide tailored recommendations, leading to increased adoption and utilization of the dashboard.
The process of integrating third-party AI automation tools with Power BI typically involves the use of APIs and other integration methods, such as webhooks and data connectors. This can be achieved through the use of Power BI's built-in features, such as the AI-powered dashboard generator, or through the use of third-party tools and techniques. By using these features, users can create interactive and automated dashboards that provide personalized insights and interactive visuals, leading to increased user engagement and adoption.
To fully realize the potential of integrating third-party AI automation tools with Power BI, it is necessary to understand the various tools and techniques available for creating interactive and automated dashboards. By exploring the different options and methodologies, users can make informed decisions about how to integrate AI-powered features into their Power BI dashboards and create a more efficient and effective development process.
In the next section, we will explore the best practices for building interactive Power BI dashboards with AI automation, including the importance of designing interactive dashboards for enhanced user experience. By understanding the capabilities and limitations of these features, users can fully use their Power BI dashboards and create a more engaging and interactive experience for their audience.
Best Practices for Building Interactive Power BI Dashboards with AI Automation

Following best practices for AI automation in Power BI can increase dashboard adoption by up to 30% through improved user experience and functionality. This is achieved by using established guidelines and methodologies for AI automation and dashboard development, providing users with a more immersive and responsive experience. By using machine learning algorithms and natural language processing, AI-powered dashboards can analyze user behavior and provide tailored recommendations, leading to increased adoption and utilization of the dashboard.
The process of building interactive Power BI dashboards with AI automation typically involves the use of established guidelines and methodologies, such as designing interactive dashboards for enhanced user experience. This can be achieved through the use of Power BI's built-in features, such as the AI-powered dashboard generator, or through the use of third-party tools and techniques. By using these features, users can create interactive and automated dashboards that provide personalized insights and interactive visuals, leading to increased user engagement and adoption.
To fully realize the potential of building interactive Power BI dashboards with AI automation, it is necessary to understand the various tools and techniques available for creating interactive and automated dashboards. By exploring the different options and methodologies, users can make informed decisions about how to integrate AI-powered features into their Power BI dashboards and create a more efficient and effective development process.
In the next section, we will provide a detailed overview of the process of designing interactive dashboards for enhanced user experience, including the importance of using interactive filters and drill-down capabilities. By understanding the capabilities and limitations of these features, users can fully use their Power BI dashboards and create a more engaging and interactive experience for their audience.
Designing Interactive Dashboards for Enhanced User Experience
Designing interactive dashboards for enhanced user experience is critical for increasing user engagement and adoption. This can be achieved by using interactive filters and drill-down capabilities, providing users with a more immersive and responsive experience. By using machine learning algorithms and natural language processing, AI-powered dashboards can analyze user behavior and provide tailored recommendations, leading to increased adoption and utilization of the dashboard.
The process of designing interactive dashboards for enhanced user experience typically involves the use of established guidelines and methodologies, such as using interactive filters and drill-down capabilities. This can be achieved through the use of Power BI's built-in features, such as the AI-powered dashboard generator, or through the use of third-party tools and techniques. By using these features, users can create interactive and automated dashboards that provide personalized insights and interactive visuals, leading to increased user engagement and adoption.
To fully realize the potential of designing interactive dashboards for enhanced user experience, it is necessary to understand the various tools and techniques available for creating interactive and automated dashboards. By exploring the different options and methodologies, users can make informed decisions about how to integrate AI-powered features into their Power BI dashboards and create a more efficient and effective development process.
Key takeaways: building interactive Power BI dashboards with AI automation can have a significant impact on user engagement and adoption. By using machine learning algorithms and natural language processing, AI-powered dashboards can analyze user behavior and provide tailored recommendations, leading to increased adoption and utilization of the dashboard. To get started with building interactive Power BI dashboards with AI automation, contact us at joparo@joparoindustries.ai or schedule a discovery call at cal.com/john-roberts-bes2ha/strategy-briefing.