Introduction to Tableau Desktop and Interactive Dashboards
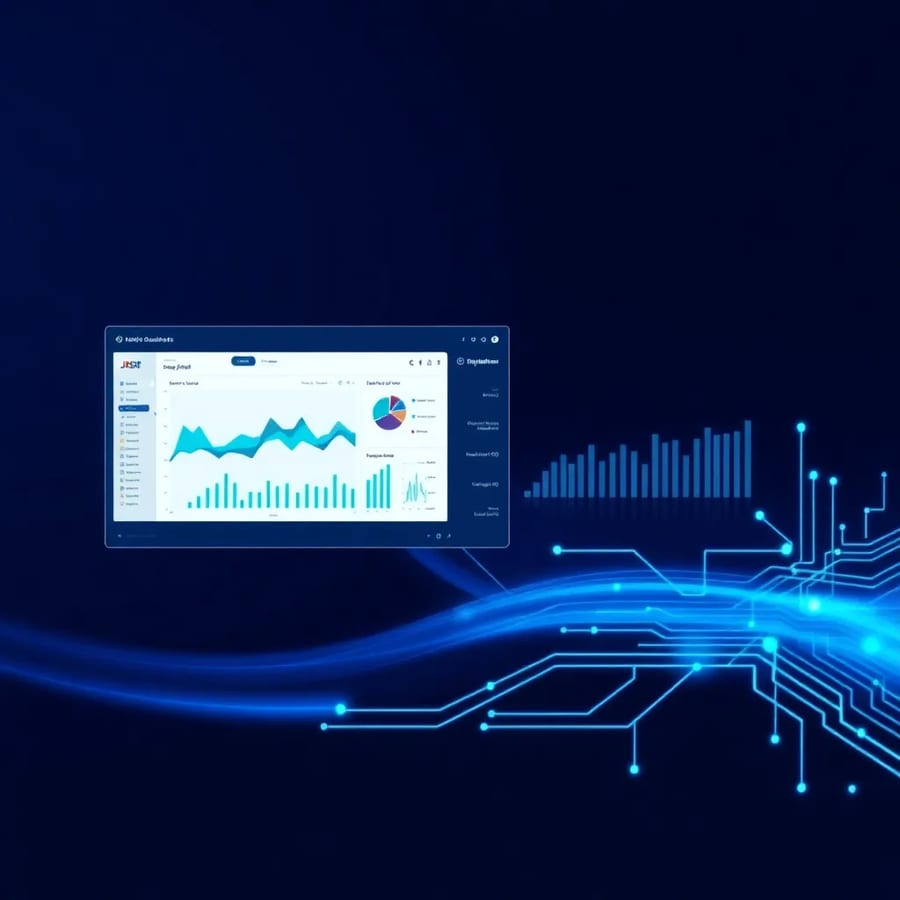
Yes, Tableau Desktop is a powerful tool for creating interactive executive dashboards that provide real-time insights and enable evidence-based decision-making.
The importance of interactive dashboards cannot be overstated, as they provide executives with the ability to explore data in detail and gain a deeper understanding of business performance and trends. This is particularly important in industries where evidence-based decision-making is critical, such as finance and healthcare. By using Tableau Desktop, users can create interactive dashboards that provide actionable insights, enabling executives to make informed decisions quickly and efficiently. Furthermore, the use of interactive dashboards can also help to improve communication and collaboration among team members, as they provide a shared understanding of business performance and trends.
Benefits of Interactive Dashboards for Executive Decision-Making
Interactive dashboards provide executives with real-time insights and enable evidence-based decision-making by allowing users to explore data in detail. By facilitating a deeper understanding of business performance and trends, interactive dashboards enable executives to identify areas of improvement, track key performance indicators, and make informed decisions. For example, an interactive dashboard can help executives to track sales performance, customer engagement, and market trends, allowing them to adjust their strategies accordingly. The use of interactive dashboards can also help to improve the speed and accuracy of decision-making, as executives can quickly and easily access the data they need to make informed decisions. Additionally, interactive dashboards can also help to reduce the risk of errors and misinterpretation of data, as they provide a clear and concise visualization of complex data insights.Overview of Tableau Desktop Features and Capabilities
Tableau Desktop offers a range of features and tools that support the creation of interactive dashboards, including data visualization, filtering, and drill-down capabilities. The software's intuitive interface and drag-and-drop functionality make it easy to create interactive dashboards, even for users without extensive technical expertise. For instance, users can connect to various data sources, such as spreadsheets, databases, and cloud-based data warehouses, and create interactive visualizations that enable executives to explore data in detail. The ability to filter and drill down into data is particularly important, as it allows executives to identify specific trends and patterns, and gain a deeper understanding of business performance and trends. Furthermore, Tableau Desktop also provides a range of data preparation tools, such as data cleaning and data transformation, which enable users to prepare and connect to complex data sources. The transition to the next section is crucial, as it will provide a deeper understanding of how to design effective dashboards for complex data structures. By applying best practices for dashboard design, users can create interactive dashboards that provide actionable insights and enable executives to make informed decisions quickly and efficiently.Designing Effective Dashboards for Complex Data Structures

Best Practices for Dashboard Design and Layout
A clear and intuitive dashboard design is essential for effective communication of complex data insights by applying best practices for dashboard design. By using a consistent layout, and providing clear and concise labels and annotations, users can create dashboards that are easy to navigate and understand. For instance, users can use a grid-based layout to organize visualizations, and provide clear and concise labels and annotations to explain complex data insights. The use of color and visualization is also important, as it can help to draw attention to key trends and patterns, and provide a clear and concise visualization of complex data insights. Furthermore, the ability to customize the dashboard design and layout is also critical, as it enables users to meet the specific needs of executive stakeholders, and provide actionable insights that enable them to make informed decisions.Using Tableau Desktop to Create Interactive Visualizations
Tableau Desktop provides a range of tools and features that support the creation of interactive visualizations, including filtering, drill-down, and animation capabilities. By using these features, users can create interactive visualizations that enable executives to explore data in detail and gain a deeper understanding of business performance and trends. For example, users can create interactive bar charts, line charts, and scatter plots that enable executives to track key performance indicators, and provide actionable insights that enable them to make informed decisions. The ability to filter and drill down into data is particularly important, as it allows executives to identify specific trends and patterns, and gain a deeper understanding of business performance and trends. Additionally, the use of animation and storytelling is also critical, as it can help to provide a clear and concise visualization of complex data insights, and enable executives to make informed decisions quickly and efficiently. The transition to the next section is crucial, as it will provide a deeper understanding of how to work with complex data structures in Tableau Desktop. By using Tableau Desktop's data preparation and connection tools, users can prepare and connect to complex data sources, and create interactive dashboards that provide actionable insights.Working with Complex Data Structures in Tableau Desktop